Radon maps of Finland
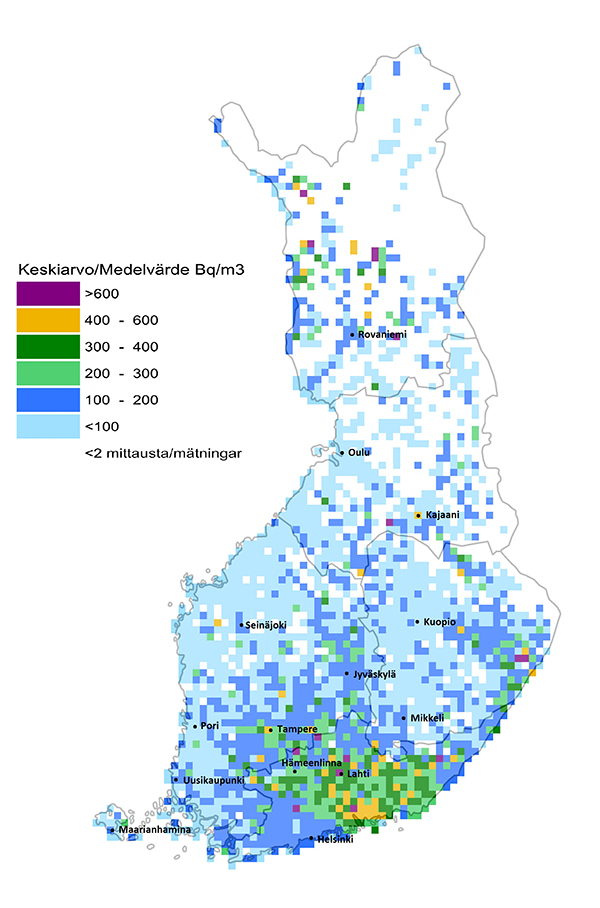
The radon maps of Finland are based on measurements conducted in low-rise residential buildings by STUK and Sustera Radon Consulting Oy, using radon measurement detectors. The first radon map shows the medians of radon concentration by municipality. The second map shows the average radon concentration over an area of 10x10 square kilometres.
STUK recommends radon measurements in all areas in Finland, as high concentrations have been measured in all types of areas.
If several measurements have been conducted in the same dwelling, such as before and after radon mitigation measures, the highest measured concentration is included. The maps show the annual average radon concentration in the dwellings, obtained by multiplying the result of the measurement made during the measurement period (from the beginning of September to the end of May) by 0.9.
Medians by municipality
The map is based on data stored in Sotkanet. The measurements have been made using STUK’s radon measurement boxes between 1990 and April 2024. To take a closer look at the map zoom in.
You can also view the map on the Suomi.fi map service.
Averages by map square